

TradersLink
Trading Journal Daily Trade Tracker Trade Analyzer Trade Analytics
Help Log in Sign up free

Trade Analyzer

A Trade Analyzer that shows what happened between entry and exit.

Analyze the completed trade on the chart, then study the decisions and price movement around each fill.

TradersLink keeps entries, exits, candle context, profit capture, and risk evidence connected to the trade that produced them.

Sign up free

No credit card required.

TradersLink Analyzer chart showing numbered buy and sell executions, candle-pattern labels, Session VWAP, EMA 9, and the completed trades below

Trade analysis

Trade Analyzer collects the data.

The Trade Analyzer connects each execution to the market data around it—entries, exits, candle patterns, VWAP, and EMA 9—then uses that data across trades to surface patterns in how you trade.

  1. See every entry and exit

    Every BUY and SELL is plotted directly on the chart and numbered in execution order, making it easy to follow entries, adds, partial exits, and the final exit.

  2. See detected candle patterns

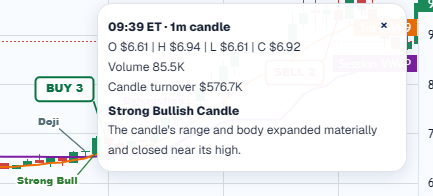
    When the analyzer detects a supported candle pattern near an entry or exit, its name appears on the chart. Select the label to open details about the pattern and the candle where it occurred.

  3. Measure entries and exits

    The analyzer measures where executions occurred in relation to Session VWAP and EMA 9, along with other market observations surrounding the trade. Those measurements become data you can compare over time.

  4. Build your trading history

    One chart explains one trade. The analyzer turns what happened across many trades into usable data that can surface repeated behaviors, entry and exit tendencies, and patterns worth studying.

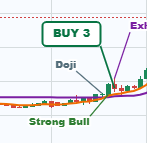
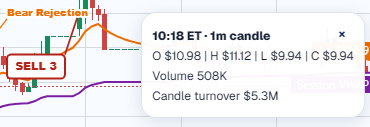
Selected one-minute Strong Bullish Candle with OHLC, volume, turnover, and pattern details The matching Strong Bullish Candle label beside the third buy execution Selected one-minute candle showing open, high, low, close, volume, and candle turnover values

Written trade analysis

See the trade clearly, one timeframe at a time.

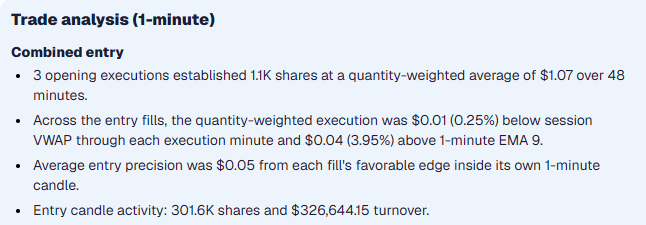
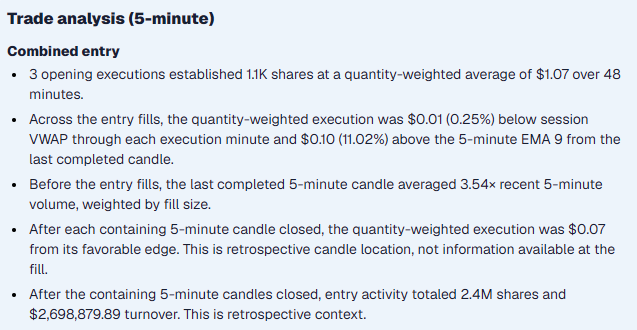
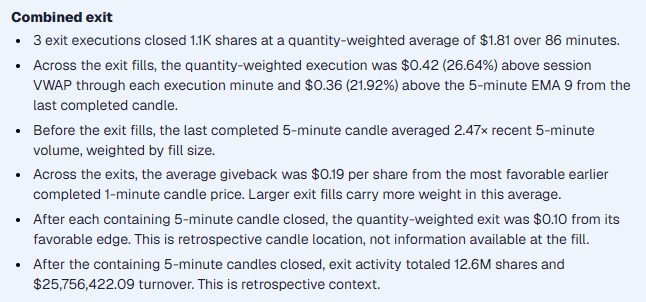
A fast trade can tell a different story when you zoom out. TradersLink turns the saved chart and executions into readable one-minute and five-minute analysis, then brings every fill together to explain the completed entry and exit.

Built from saved executions and completed-candle data.
1-minute analysis One-minute written analysis of combined entries, VWAP and EMA 9 distance, execution precision, volume, and turnover
5-minute analysis Five-minute written analysis of combined entries, VWAP and EMA 9 distance, relative volume, favorable edge, and turnover
Combined exit analysis Combined exit analysis covering weighted exit price, VWAP and EMA 9 distance, relative volume, giveback, and favorable edge

Entry & Exit analysis

Study every entry, add, partial exit, and final exit.

Every entry and exit is analyzed where it happened—its distance from Session VWAP and EMA 9, relative volume, candle position, and the favorable or adverse move that followed when market data supports it.

Instead of judging a trade only by the final P/L, review what was happening around each execution and compare completed trades to find patterns in your entries, exits, and decision-making.

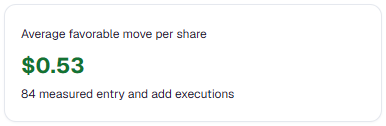
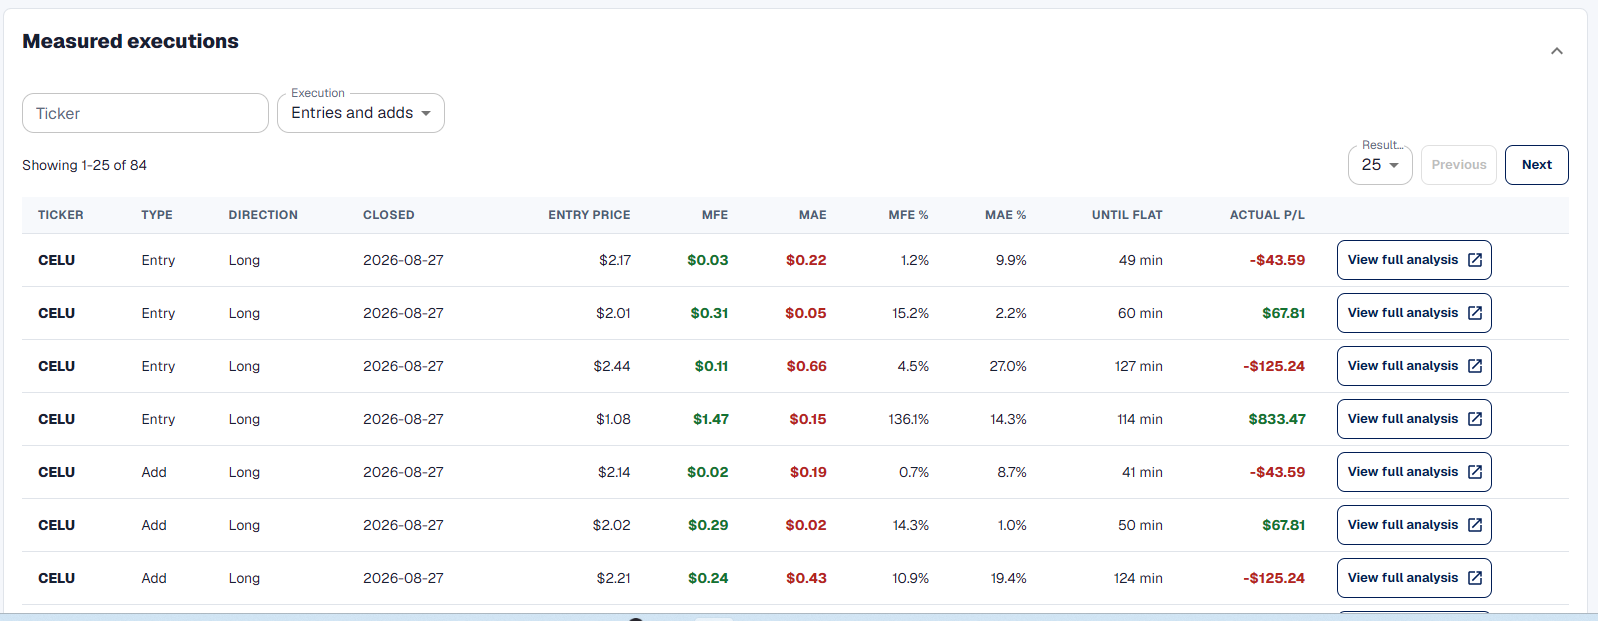
Average favorable move per share of 53 cents across 84 measured entry and add executions
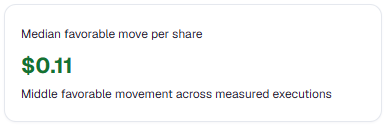
Median favorable move per share of 11 cents across measured executions
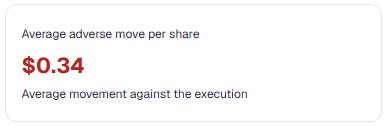
Average adverse move per share of 34 cents after a measured execution
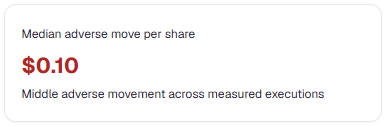
Median adverse move per share of 10 cents across measured executions
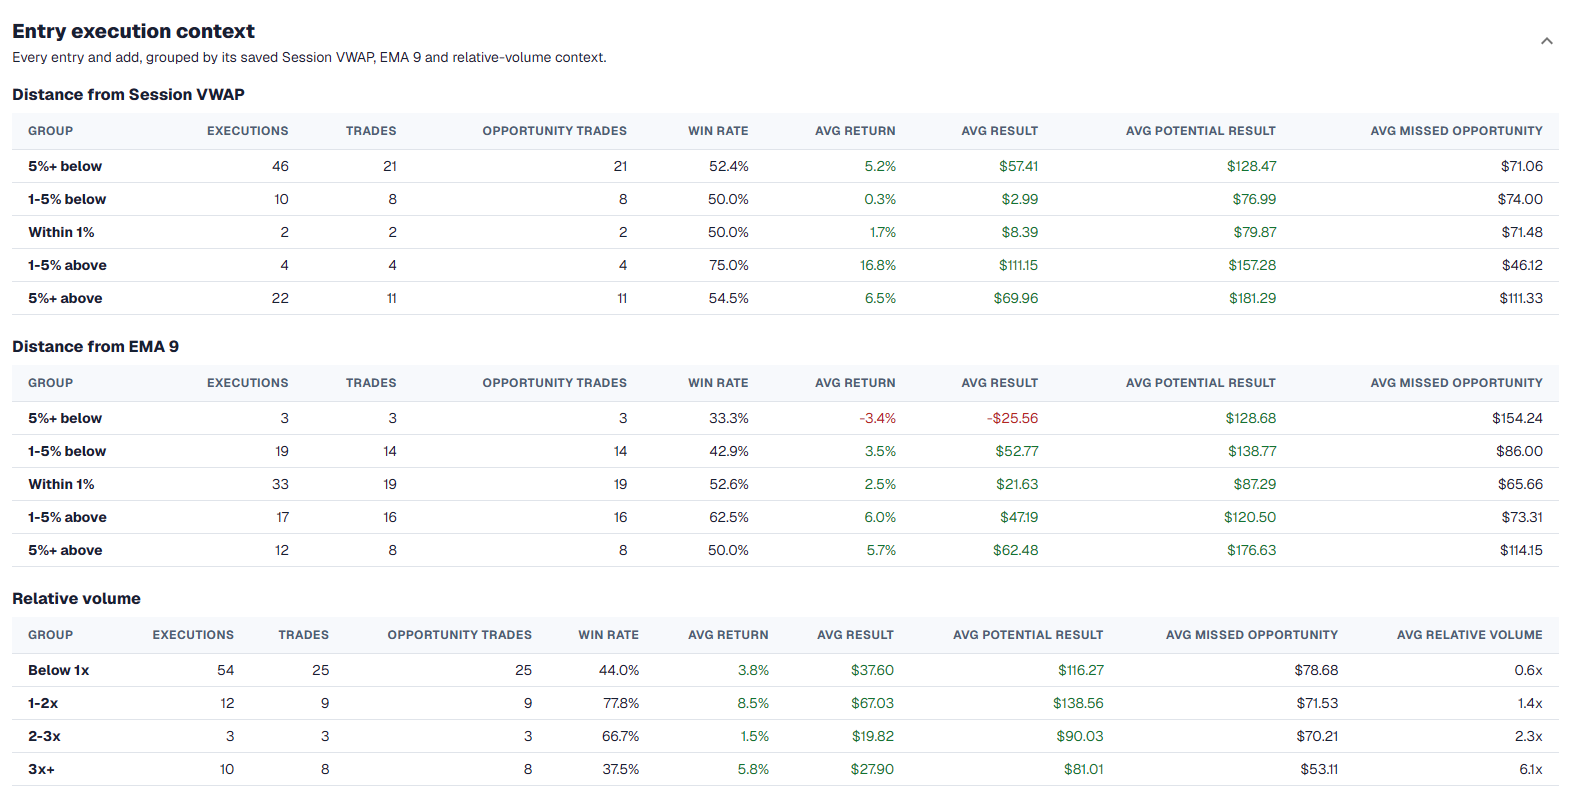
Execution context across completed trades
Entry execution results grouped by distance from Session VWAP, distance from EMA 9, and relative volume

MFE & MAE

See how far price moved for you—and against you.

Track MFE and MAE to see how far each trade moved in your favor and against you after entry. Use it to spot poor entries, profit giveback, early exits, and whether you’re consistently taking more heat than your setups should require.

Maximum Favorable Excursion

See how far price moved in your favor after each entry, measured per share and as a percentage of your entry price.

Maximum Adverse Excursion

See how far price moved against you after each entry, helping you compare the opportunity in a trade with the risk you took along the way.

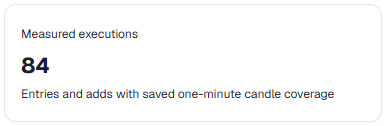
84 measured entry and add executions with saved one-minute candle coverage
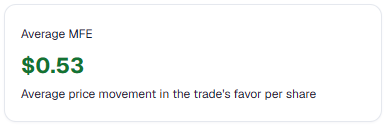
Average maximum favorable excursion of 53 cents per share
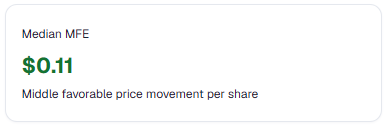
Median maximum favorable excursion of 11 cents per share
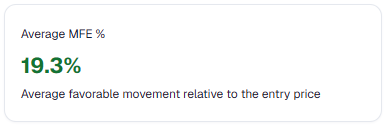
Average maximum favorable excursion of 19.3 percent relative to entry price
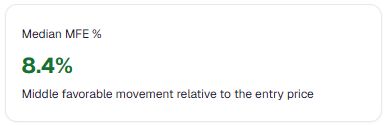
Median maximum favorable excursion of 8.4 percent relative to entry price
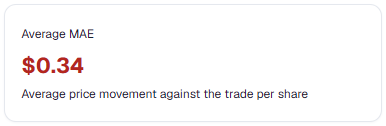
Average maximum adverse excursion of 34 cents per share
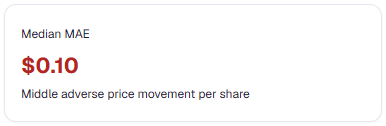
Median maximum adverse excursion of 10 cents per share
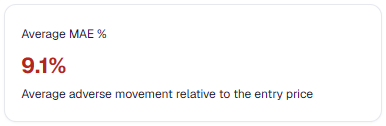
Average maximum adverse excursion of 9.1 percent relative to entry price
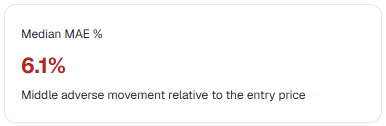
Median maximum adverse excursion of 6.1 percent relative to entry price
Measured executions table with ticker, entry or add, direction, entry price, MFE, MAE, percentages, time until flat, and actual profit or loss

Green-to-Red analysis

See where open profit became giveback.

Green-to-Red analysis tracks completed trades that moved into profit before falling back through breakeven.

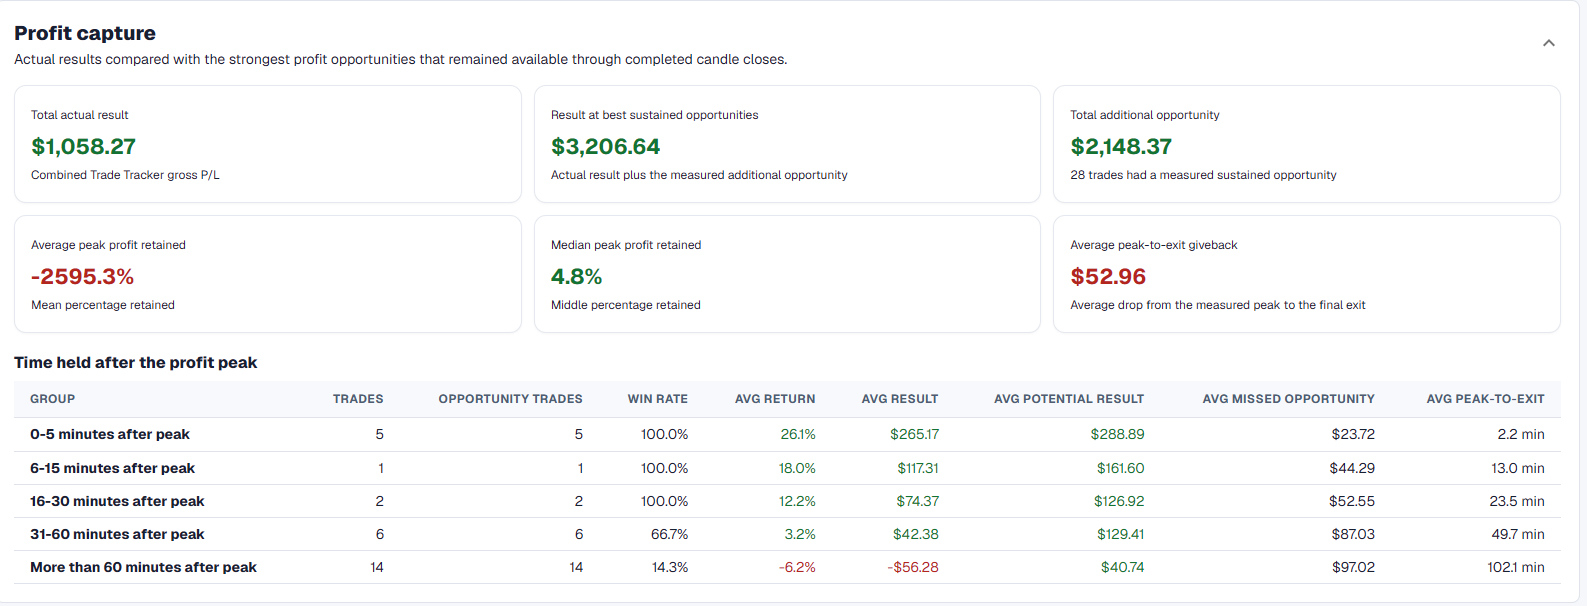
See how much upside the trade offered, how much of that move was captured or given back by the exit, how quickly the trade first turned red, and whether price later recovered after the loss.

Profit Capture results showing actual result, sustained opportunity, retained profit, giveback, and results grouped by time held after the profit peak

When green turned red

A trade that moves green and still finishes red can reveal a lot about exit discipline and profit protection. Separate trades that stayed green, recovered after turning red, or gave back the move entirely—and measure how long they held up, how quickly they recovered, and how much opportunity was lost before the final exit.

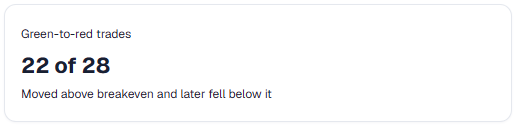
22 of 28 analyzed trades moved above breakeven and later fell below it
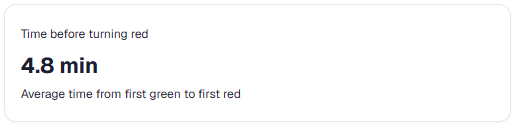
Average time of 4.8 minutes before a trade first turned red
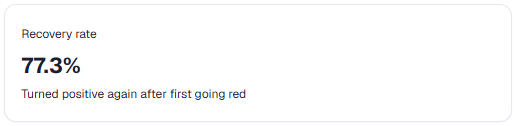
Recovery rate of 77.3 percent after first turning red
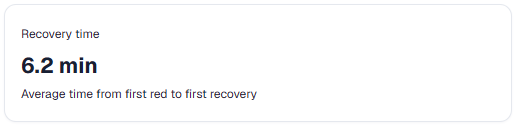
Average recovery time of 6.2 minutes
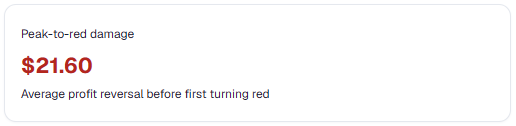
Average peak-to-red damage of 21 dollars and 60 cents
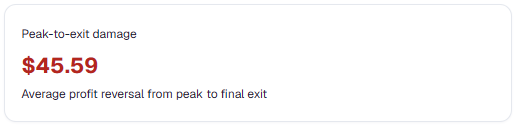
Average peak-to-exit damage of 45 dollars and 59 cents
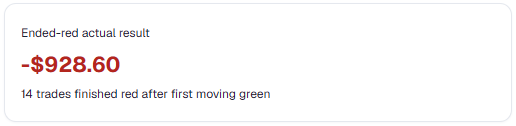
Ended-red actual result of negative 928 dollars and 60 cents
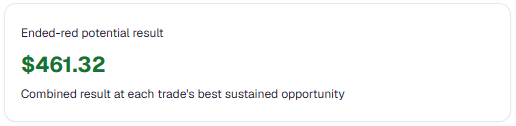
Ended-red potential result of 461 dollars and 32 cents
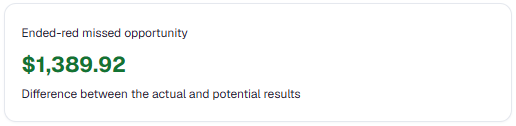
Ended-red missed opportunity of 1,389 dollars and 92 cents

Risk-management behavior

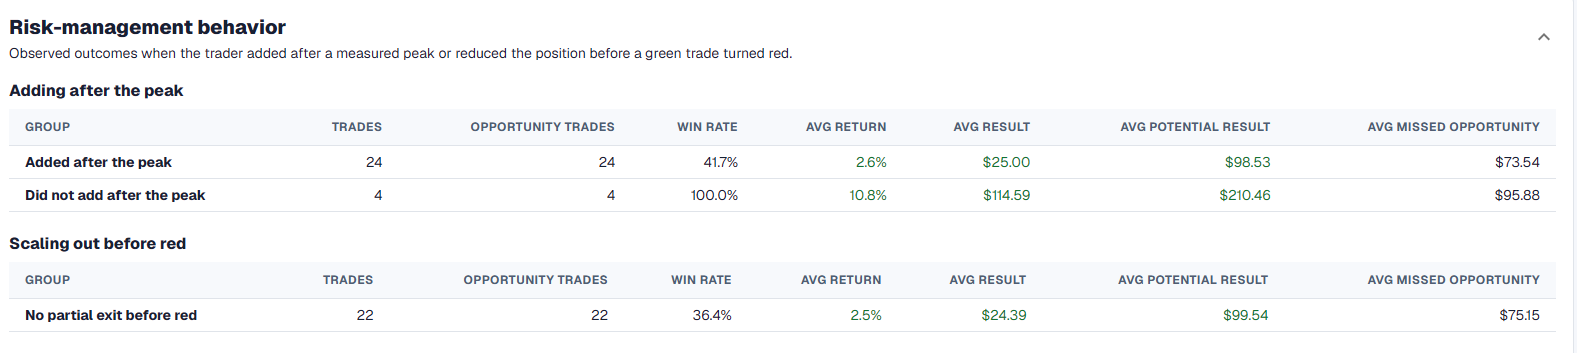
Risk management is often what separates a good trade from a bad result. Compare how adding after a trade has peaked or reducing size before it turns red lined up with the outcome, and identify habits that may be protecting profits—or putting them at risk.

Risk-management results grouped by adding after the measured peak and scaling out before a green trade turned red

Candle pattern analysis

Connect candle patterns to real executions.

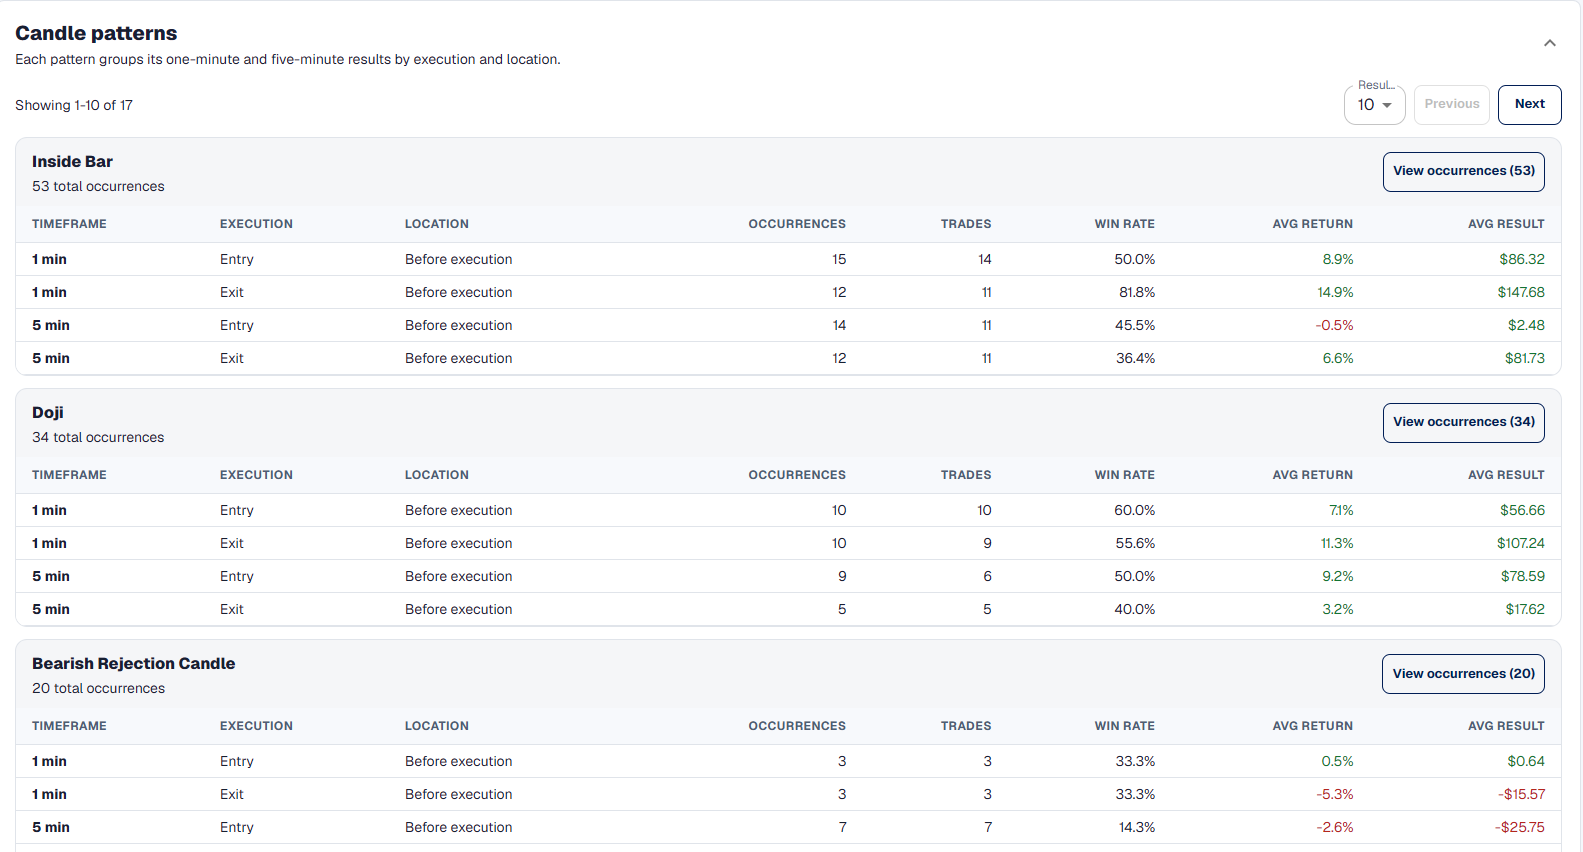
Trade Analyzer records supported completed-candle patterns around entries and exits on one-minute and five-minute charts. Each observation stays tied to the execution, timeframe, and location where it appeared.

Across completed trades, see how often a pattern appeared before an entry or exit and compare the trades, win rate, average return, and average result connected to those observations.

Candle-pattern results grouped by pattern, one-minute or five-minute timeframe, entry or exit, and execution location

Patterns the analyzer can recognize

The detector identifies supported candle patterns around entries and exits, then saves those observations with the trade so the data can be compared across trading history and used to surface recurring patterns over time.

Candle-pattern labels displayed on the Trade Analyzer chart

Compression and breaks

Compression records a tightening completed-candle structure. Bullish and Bearish compression breaks identify the direction when price expands out of that structure.

  • Compression
  • Bullish compression break
  • Bearish compression break

Engulfing shifts and expansion

Bullish and Bearish engulfing shifts record a completed change in candle-body control. Bullish and Bearish expansion identify a material increase in completed range and body.

  • Bullish engulfing shift
  • Bearish engulfing shift
  • Bullish expansion
  • Bearish expansion

Confirmed reversals and wick rejection

Confirmed Hammer, Confirmed Shooting Star, Lower-wick rejection, and Upper-wick rejection describe completed candles where the body and wick show a defined rejection structure.

  • Confirmed Hammer
  • Confirmed Shooting Star
  • Lower-wick rejection
  • Upper-wick rejection

High-volume exhaustion

Possible high-volume exhaustion records a completed candle where price movement and elevated volume meet the detector’s exhaustion conditions.

  • Possible high-volume exhaustion

See which patterns appear most often

Most frequently observed candle patterns ranked by occurrence count

Results across trades

Turn completed trade reviews into patterns you can study.

Trade Analyzer saves comparable measurements from completed trades into dedicated results pages. Move from one chart to the larger picture, compare groups, and open the trades behind the numbers when something stands out.

Entry & Exit results

Compare where entries and exits occurred around Session VWAP, EMA 9, relative volume, and candle position across completed trades.

Full TradersLink Entry and Exit results dashboard with summary cards and grouped execution results

MFE & MAE results

Compare the favorable and adverse movement that developed after measured entries and adds, in dollars per share and as a percentage of entry price.

Full TradersLink MFE and MAE dashboard with favorable and adverse movement results

Green-to-Red results

Study profit capture, giveback, recovery, and risk-management behavior across completed trades that moved into profit.

Full TradersLink Green-to-Red dashboard with profit-capture cards and outcome results

Candle Pattern results

See which supported patterns appeared around entries and exits, compare the recorded groups, and return to the underlying occurrences.

Full TradersLink Candle Pattern results dashboard with observed pattern groups

Trade Analyzer FAQ

Questions you may want answers to

The best answers are inside the dashboard. Entry is free no credit card required.

What is a trade analyzer?

A trade analyzer connects completed trades to the chart and market data around each execution. TradersLink turns entries, exits, candle observations, MFE and MAE, Green-to-Red measurements, and written analysis into results you can review across trades.

How does TradersLink analyze entries and exits?

TradersLink analyzes each saved buy and sell at the time it occurred, including distance from Session VWAP and EMA 9, relative volume, candle position, and favorable or adverse movement when supported market data is available.

What do MFE and MAE mean in trading?

Maximum Favorable Excursion shows how far price moved in your favor after entry. Maximum Adverse Excursion shows how far it moved against you. TradersLink reports both per share and as a percentage of entry price.

What does Green-to-Red analysis show?

Green-to-Red analysis reviews completed trades that moved into profit before falling through breakeven. It shows the strongest sustained opportunity, captured profit, giveback, time before turning red, recovery, and the final outcome.

Which candle patterns can TradersLink detect?

The current detector supports Compression; Bullish and Bearish compression breaks; Bullish and Bearish engulfing shifts; Bullish and Bearish expansion; Confirmed Hammer; Confirmed Shooting Star; Lower-wick and Upper-wick rejection; and Possible high-volume exhaustion.

Does Trade Analyzer tell me what trade to take?

Trade Analyzer reviews completed trades. It organizes saved executions and historical market observations so you can study your own results; it is not a live scanner or alert.

Can I open Trade Analyzer from the Daily Trade Tracker?

Yes. Open Trade Analyzer from a completed trading day to keep the chart and analysis connected to the ticker, trades, and session, or open the Analyzer separately for focused review.

Trade review starts here

Analyze your trades inside TradersLink.

Connect the completed trade to its chart, executions, profit capture, risk, and the patterns that build across your trading history.

Sign up free

No credit card required.

TradersLink, living the small cap trading life!

Privacy PolicyTerms & Conditions

Analytics choices

We use necessary storage to remember this choice. Optional analytics help us understand visits and improve TradersLink. They stay off unless you accept.

Privacy Policy · Terms & Conditions